


Most businesses launch a new website and have no clue if it’s actually working.
You spend months planning, thousands of dollars building, and weeks obsessing over every detail. Launch day comes, you celebrate with the team, post about it on social media, and then… nothing.
Traffic looks about the same. Conversions haven’t budged. You’re wondering if you just threw money at a pretty design that doesn’t actually do anything for your business.
Here’s the thing: a successful website isn’t measured by how good it looks. It’s measured by how well it performs.
And if you’re not tracking the right stuff, you’ll never know if your redesign was worth the investment or just expensive decoration.
I’ve seen this happen dozens of times. Companies get caught up in the visual excitement and forget to plan how they’ll actually measure success. Then they’re stuck guessing whether their new site is helping or hurting their business.
Stop guessing. Start measuring what actually matters.
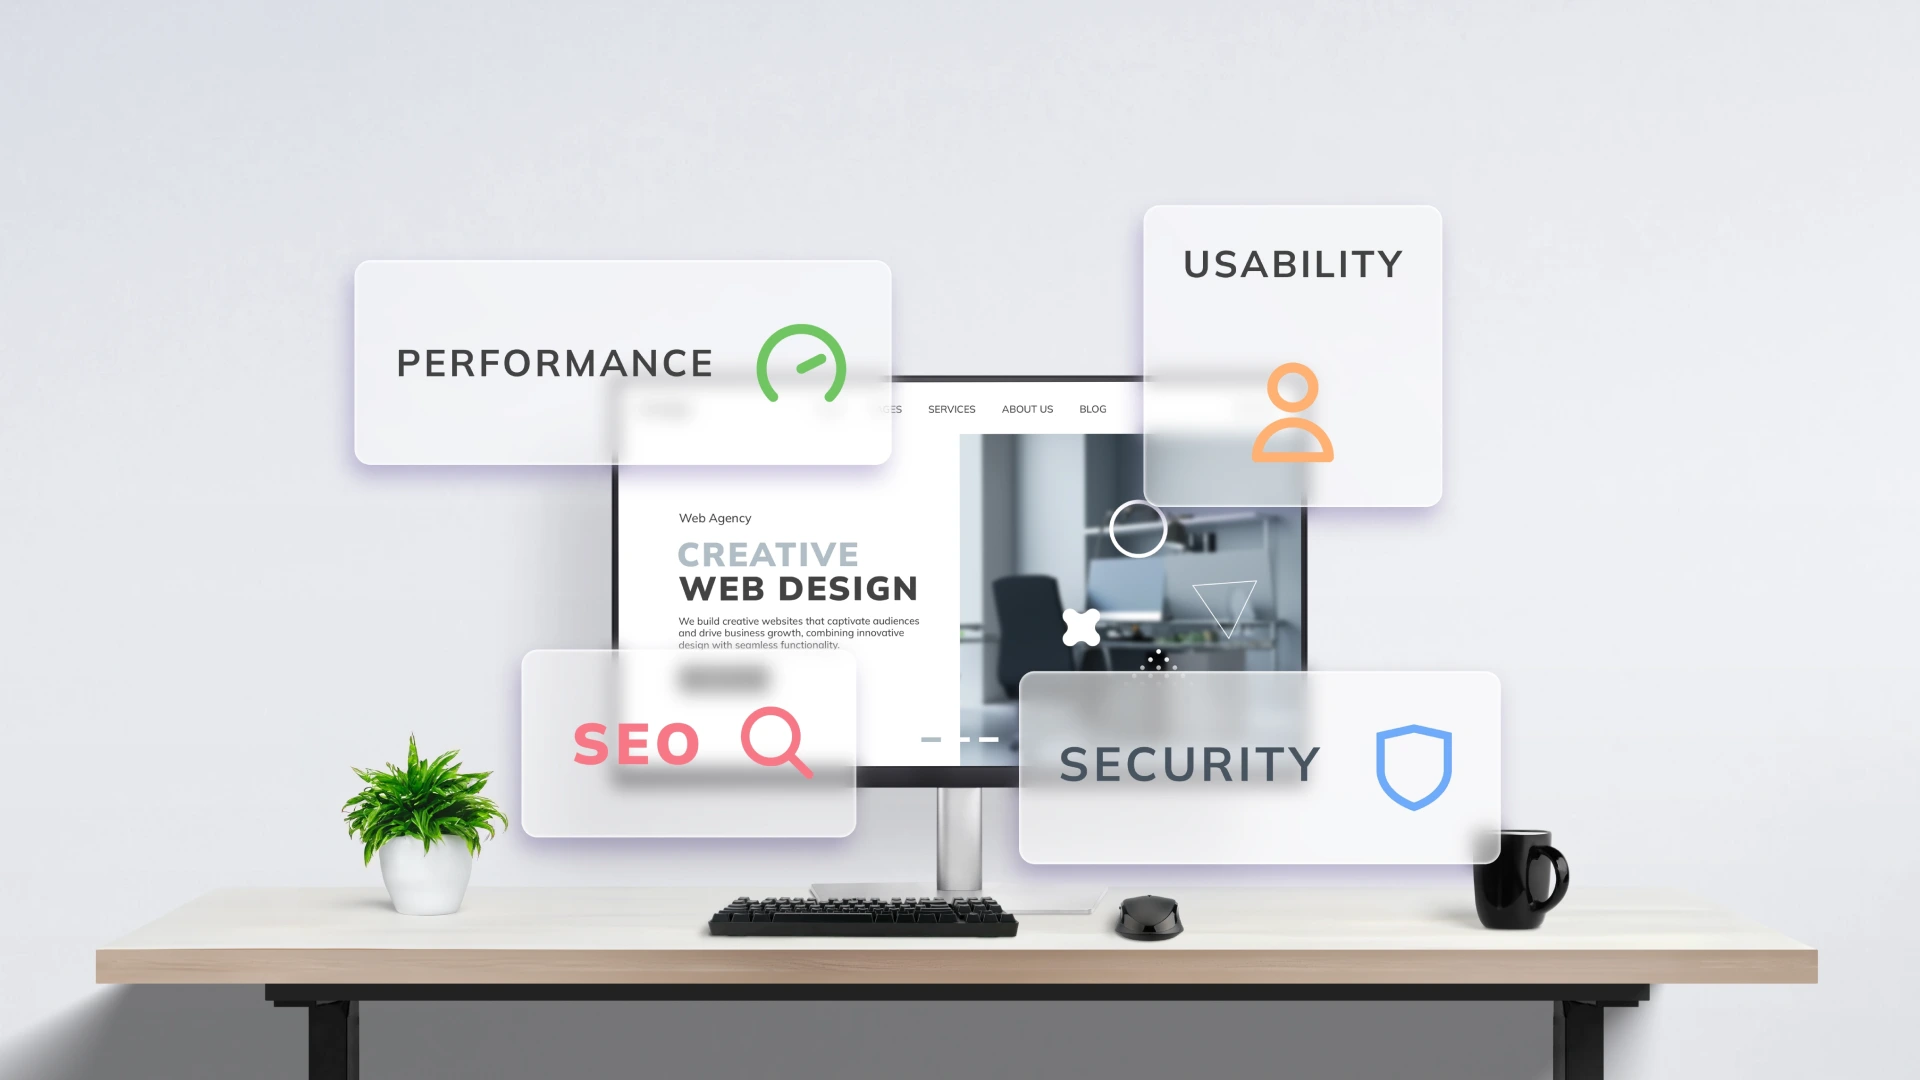
What does website success actually mean?
Website success isn’t about winning design awards or getting compliments from your friends.
You really can’t measure success by how many people say “wow, nice site.” That’s ego validation, not business results.
It’s about whether your site helps your business achieve its goals. And those goals should be specific, measurable things that directly impact your bottom line.
Here’s what real website success looks like:
Alignment with business goals. Your website should directly support whatever you’re trying to accomplish. Generate leads, drive sales, build brand awareness, whatever. If your site isn’t moving the needle on your primary business objectives, it’s not successful.
Seamless user experience. Visitors should be able to find what they’re looking for without getting confused, frustrated, or lost. The navigation, structure, and design should make their journey intuitive.
Authentic brand representation. Your site should feel like your business. The tone, visuals, and messaging should capture who you are and what you stand for.
When your website nails these three things, it becomes a business asset that actually drives results instead of just looking professional.


The stuff you can’t measure (but still matters)
Not everything that matters shows up in your analytics dashboard. Some of the most important aspects of website success are harder to quantify but just as critical.
Does your website feel authentic?
Your website should reflect your company’s mission, values, and personality. I’m talking about:
Does the tone match how you actually communicate with customers? Are your company’s values evident in the design and messaging? Does the user experience feel genuine and true to your brand?
Your website is often the first impression people get of your business. If it feels generic or inauthentic, you’re starting every relationship on the wrong foot.
Is your team actually using it?
A well-designed website should be a tool for your entire team, not just marketing. When your team connects with the design and understands how to use it effectively, they become better at sales, customer service, and representing your brand.
If your team doesn’t know how to leverage the website or feels disconnected from it, that’s a problem worth addressing.
BTW – this is something most agencies completely miss. They build beautiful sites that the marketing team loves but the sales team can’t actually use to close deals.
Does everything look cohesive?
Visual consistency creates a professional impression and reinforces your brand.
This includes:
- Photography and imagery: Using a consistent style that reflects your brand identity.
- Typography: Making sure fonts and text styles feel unified across all pages.
- Interactive elements: Maintaining a harmonious look for buttons, icons, and other design components.
When everything feels cohesive, visitors trust you more and remember your brand better.
These elements might not show up in Google Analytics, but they’re essential for creating lasting impact and building relationships with your audience.
The numbers that actually tell you something

Once your website is live, you need to track specific metrics that reveal how well it’s performing. These numbers give you clear, actionable insights into what’s working and what needs fixing.
Traffic analysis (beyond vanity metrics)
Stop obsessing over total visitor counts. That’s vanity metric territory.
Traffic metrics should show you how well your website attracts and keeps visitors interested, not just how many people accidentally stumbled onto your site.
Engagement rate: How long users stay and whether they interact with multiple pages. High engagement means your content and design are resonating.
Time on site and time on page: Longer times usually indicate people find value in your content or experience.
Returning visitors: A healthy percentage of returning visitors signals ongoing interest and sustained value.
I use Google Analytics to analyze these trends, identify high-performing pages, and spot opportunities for improvement.
But here’s what most people get wrong: they obsess over total visitor counts instead of looking at engagement quality. 10,000 visitors who bounce immediately is worse than 1,000 visitors who actually explore your site and convert.
And you wonder why so many “high-traffic” websites don’t actually generate business results.
Key benchmarks to aim for:
- Average session duration: 2-3 minutes for content sites, 3-4 minutes for e-commerce
- Pages per session: 2.5+ pages for content sites, 4.5+ for e-commerce
- Bounce rate: Under 60% for content, under 40% for e-commerce
- Return visitor rate: 30%+ is solid
Conversion tracking (the numbers that matter)
Conversions tell you whether your website achieves its primary business goals. This is where you find out if your redesign actually moved the needle.
Believe me when I say this: if you’re not tracking conversions properly, you’re flying blind.
Conversion rate: The percentage of visitors who complete desired actions like purchases, form submissions, or newsletter signups. This is the clearest indicator of whether your website effectively drives engagement.
Quality of conversions: Not all conversions are equal. Are the leads you’re generating actually turning into customers? Are they the right fit for your business?
If your conversion rates are disappointing, here’s what usually fixes it:
Refine your CTAs. Make calls-to-action clear, specific, and visually prominent. Use action-oriented language that tells people exactly what to do.
Simplify your forms. Reduce friction by asking for only essential information. Shorter forms typically get higher completion rates.
Align expectations. Make sure your landing pages deliver on whatever promises you made in ads, emails, or search results. Consistency builds trust.
Industry benchmarks:
- E-commerce websites: 1.8% to 2.9% average, top performers exceed 5%
- Lead generation sites: 2% to 5% depending on form complexity
- B2B services: Often higher conversion rates but longer sales cycles
Tools like Google Analytics, HubSpot, and Mixpanel help you track user behavior leading up to conversions, identify bottlenecks, and test improvements.
SEO performance (getting found)
SEO determines whether your target audience can actually find your website. A successful redesign should improve your ability to rank in search results and attract organic traffic.
Keyword rankings: Track how your target keywords perform compared to your old site. Higher rankings indicate improved relevance and authority.
Organic search traffic: Measure the volume of traffic coming from search engines. An increase suggests your redesign enhanced SEO performance.
Click-through rate (CTR): How often users click on your site in search results. Higher CTR means your titles and meta descriptions are engaging.
I use tools like Ahrefs, SEMrush, and Google Search Console to monitor rankings, identify crawl issues, and track performance improvements.
Technical SEO factors to monitor:
- Site structure and crawlability: Clean URLs and logical navigation
- Page speed: Use Google PageSpeed Insights to meet Core Web Vitals benchmarks
- Mobile performance: Ensure your site works flawlessly on mobile devices
Getting feedback from actual users

Your users are your best source for understanding how well your website meets their needs. Direct feedback identifies what’s working and uncovers improvement opportunities you might miss otherwise.
Methods that actually work
Post-redesign surveys: Use tools like SurveyMonkey or Google Forms to gather detailed feedback. Keep surveys under 5 questions and include both rating scales and open-ended responses.
Key questions I always ask:
- How easy was it to navigate the website?
- Could you find what you were looking for quickly?
- How would you rate the overall design and usability?
- What would you improve about the experience?
Usability testing: Conduct live testing sessions with real users. I review session recordings monthly and pay attention to navigation challenges, confusing CTAs, and points where users hesitate or abandon tasks.
Performance metrics: Track Net Promoter Score (aim for 30+ in B2B, 40+ in B2C), Customer Satisfaction Score (target 80%+), and Customer Effort Score (keep under 3 on a 5-point scale).
Real examples of feedback driving improvements
Here are some common patterns I see when businesses actually listen to user feedback:
E-commerce scenario:
- Problem: Users report confusion about shipping costs, high cart abandonment
- Solution: Add shipping calculator to product pages, create delivery date estimator
- Typical results: 20-30% reduction in cart abandonment, fewer shipping-related support tickets
B2B website optimization:
- Problem: Lead forms too complex, pricing info hard to find
- Solution: Streamline forms, add pricing calculator or clear pricing pages
- Typical results: 30-40% increase in form submissions, better lead quality
User feedback shows you barriers you can’t see from analytics alone. It reveals what users value, identifies gaps in your current experience, and builds trust by showing customers their opinions matter.


A/B testing your way to better results
A/B testing lets you optimize your website by comparing different versions of specific elements to see which performs better. This data-driven approach helps you refine your design and improve engagement over time.
Elements worth testing
CTA buttons: Experiment with text, color, placement, and size to see what drives the highest conversions.
Landing page layouts: Test different designs to identify which structure best captures attention and encourages action.
Headlines and copy: Compare variations in wording to see what resonates most with your audience.
Visual elements: Evaluate the impact of different images, videos, or color schemes on user behavior.
How I run A/B tests
- Define your goal: Pick a specific metric you want to improve, like click-through rate or conversion rate.
- Create variations: Develop two versions of the element you’re testing, keeping changes isolated to maintain accurate results.
- Split your audience: Use tools like Google Optimize or Optimizely to divide your audience into segments that see different versions.
- Analyze results: Measure performance of each variation against your goal to determine the winner.
Real-world examples that worked
CTA optimization: A software company tested “Start your free trial” vs. “Try it free for 30 days.” The specific timeframe achieved 27% higher click-through rate.
Form length testing: A B2B company tested an 8-field form vs. a 3-field form. The shorter version increased submissions by 35% while maintaining lead quality.
Social proof placement: A SaaS company tested testimonials at the bottom of the page vs. distributed throughout. The distributed approach improved conversions by 23%.
A/B testing removes guesswork and lets you make decisions based on actual user behavior instead of opinions or assumptions.
Advanced metrics for deeper insights
For a more complete picture of your website’s performance, these advanced metrics provide insights into user behavior and business impact.
Page performance analysis
Top pages report: Identify which pages attract the most visitors and analyze what makes them successful. Use these insights to improve other areas of your site.
Bounce rates and exit pages: Monitor pages with high bounce or exit rates. High rates often indicate usability issues, irrelevant content, or unmet expectations.
To improve bounce rates: enhance page load speed, improve content relevance, and add engaging visuals that encourage users to stay longer.
Business impact metrics
If your website integrates with your CRM system, you can track metrics that directly tie to revenue:
Average order value (AOV): Understand purchasing patterns and identify upselling opportunities.
Customer lifetime value (CLV): Measure total revenue generated per customer over time.
Cost per conversion and cost per acquisition: Evaluate how efficiently your marketing drives conversions and new customers.
These metrics connect your website’s performance to actual business outcomes, giving you a clearer picture of ROI.
User behavior insights
Behavior flow analysis: Visualize how users navigate your website and identify drop-off points. Use Google Analytics to examine pages with high abandonment and streamline critical conversion paths.
Heatmaps: Get visual snapshots of user interaction showing where visitors click, scroll, or linger. Tools like Hotjar and Crazy Egg help you optimize layouts and improve user experience.
Social shares: Track how well your content resonates and expands your reach. Use insights to refine content strategies and encourage sharing with embedded social buttons.
Technical performance that impacts everything
Website speed directly affects user behavior, influencing bounce rates, engagement, and conversions. Faster-loading pages retain more visitors and create better experiences.
Key speed metrics to monitor
Page load time: Aim for under 3 seconds to reduce abandonment.
First Contentful Paint (FCP): Shorter times make your site feel fast and responsive.
Largest Contentful Paint (LCP): Faster loading of key elements enhances user satisfaction.
How to improve speed
- Compress images without sacrificing quality.
- Minify CSS, JavaScript, and HTML to eliminate unnecessary data.
- Use a Content Delivery Network (CDN) to improve load times globally.
Google PageSpeed Insights provides detailed suggestions and lets you track progress over time.
Accessibility matters more than you think
Ensuring your website is accessible isn’t just good practice; it’s necessary. Accessibility enhances user experience, expands your audience, and ensures legal compliance.
Key accessibility metrics:
- WCAG 2.1 compliance for usability standards
- Keyboard navigation functionality
- Screen reader compatibility with proper alt text
- Color contrast meeting readability guidelines
Tools like WAVE, axe, and Lighthouse help identify and fix accessibility issues. An accessible website benefits all users, improves usability, and can even boost SEO performance.
Taking action on what you learn

Now that you know how to measure website success, here’s how to turn insights into strategic improvements.
Create your measurement framework
- Choose primary KPIs based on your business goals.
- Set up tracking tools and dashboards.
- Establish regular reporting intervals. Define benchmarks and targets.
Build a testing calendar
Plan regular evaluations of core user journeys, high-traffic pages, critical conversion points, mobile experience, and site speed performance.
Establish a feedback loop
Share insights across teams, document successful improvements, learn from unsuccessful changes, and update strategies based on data.
Your website should evolve with your business. Regular evaluation isn’t just about measuring success; it’s about identifying growth opportunities and ensuring your digital presence serves both your business and your audience effectively.
Start with one metric that directly ties to your most important business goal, and build from there. Success isn’t about tracking everything at once; it’s about measuring what matters most to your growth.
Stop guessing whether your website redesign worked. Start measuring what actually moves your business forward.
Because at the end of the day, a beautiful website that doesn’t deliver results is just expensive decoration.